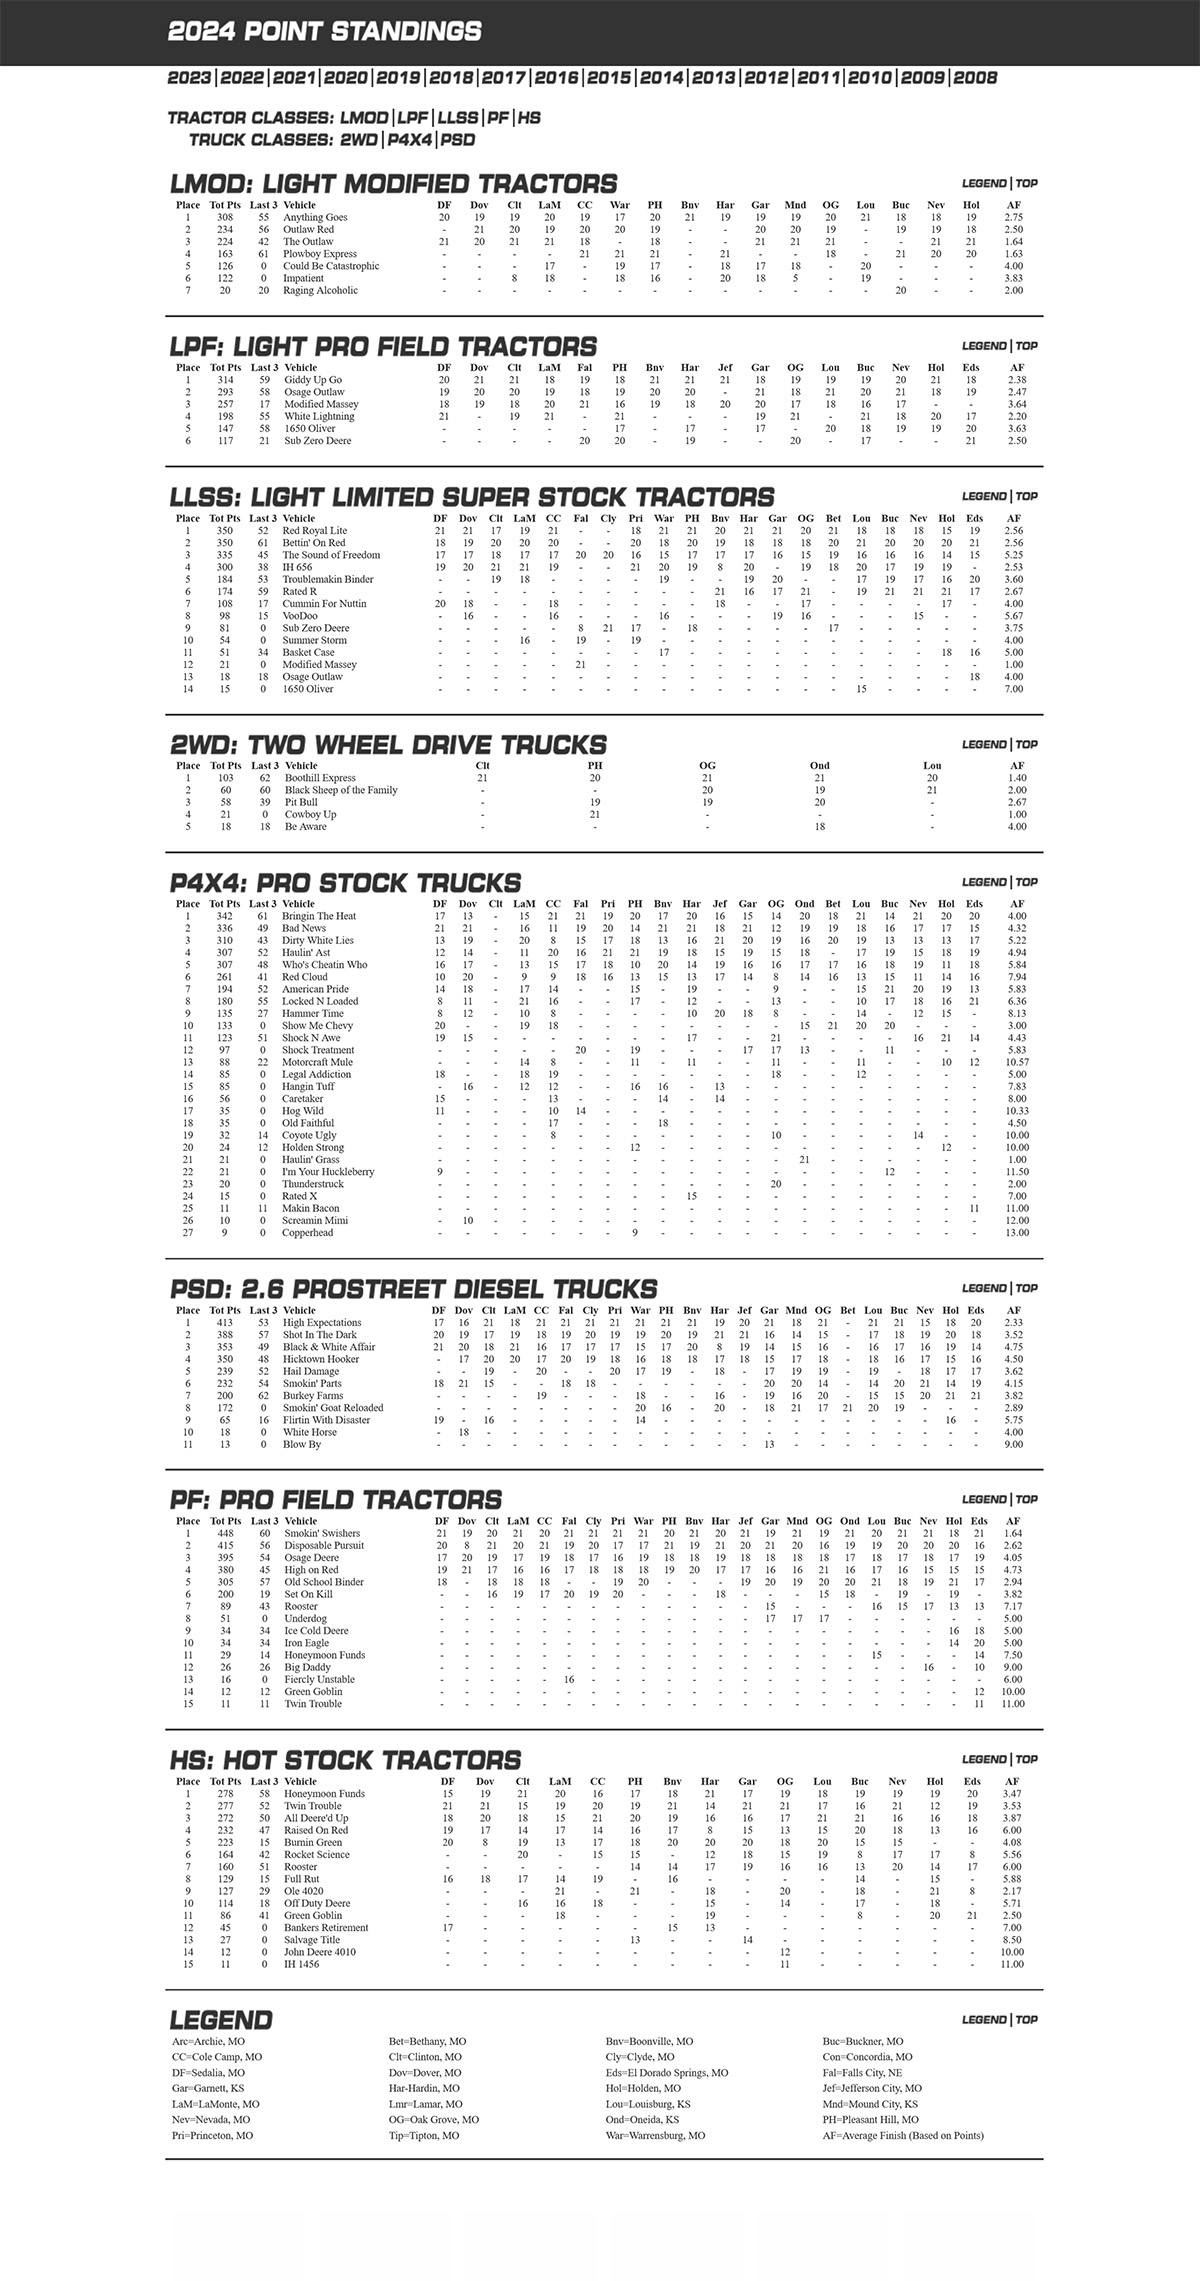
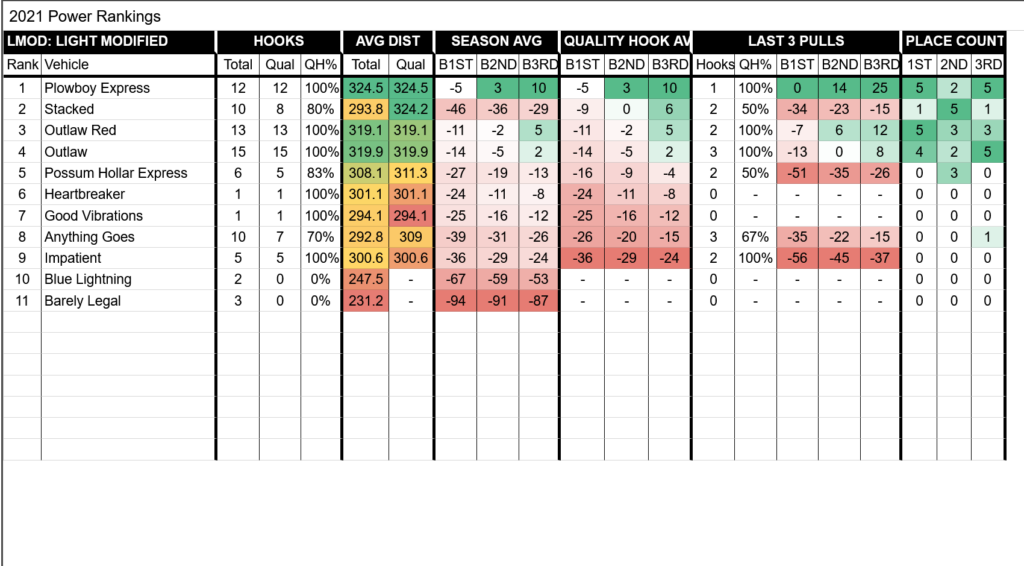
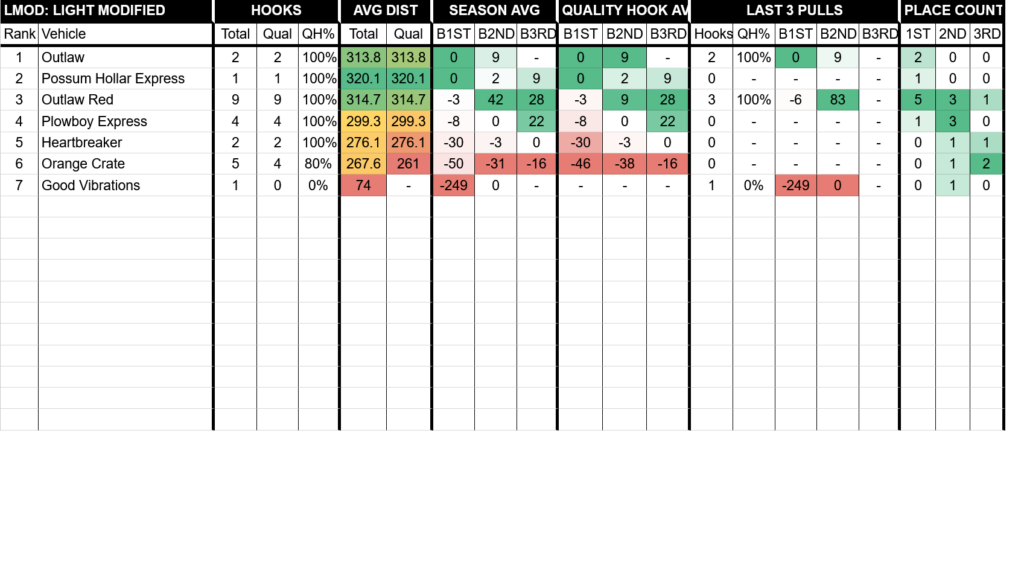
LMOD

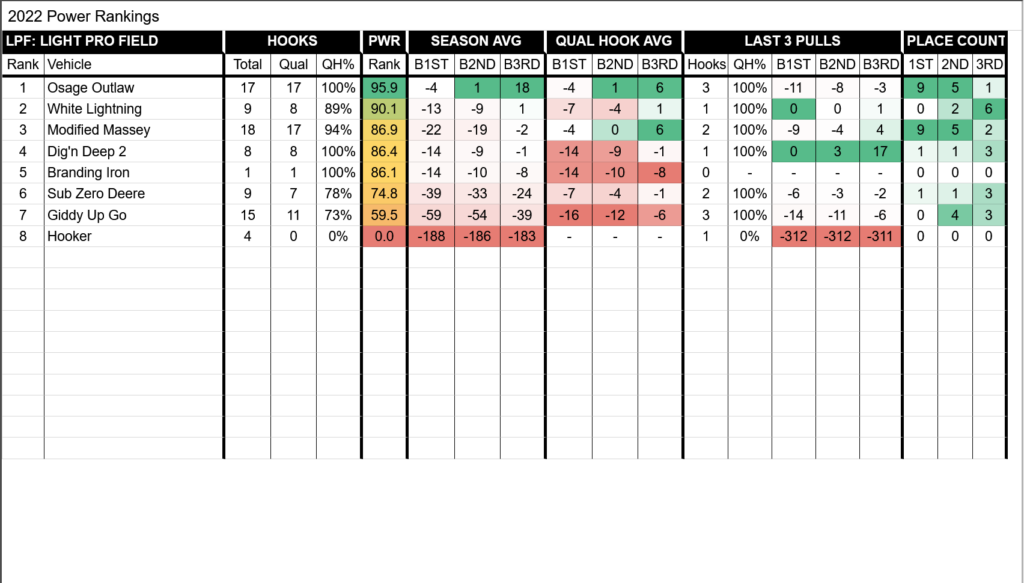
LPF

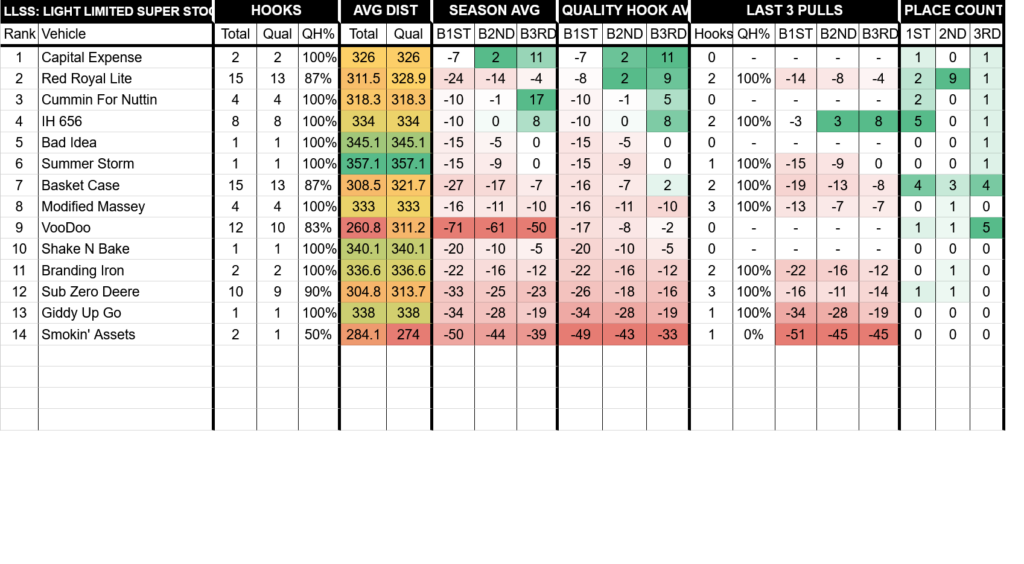
LLSS

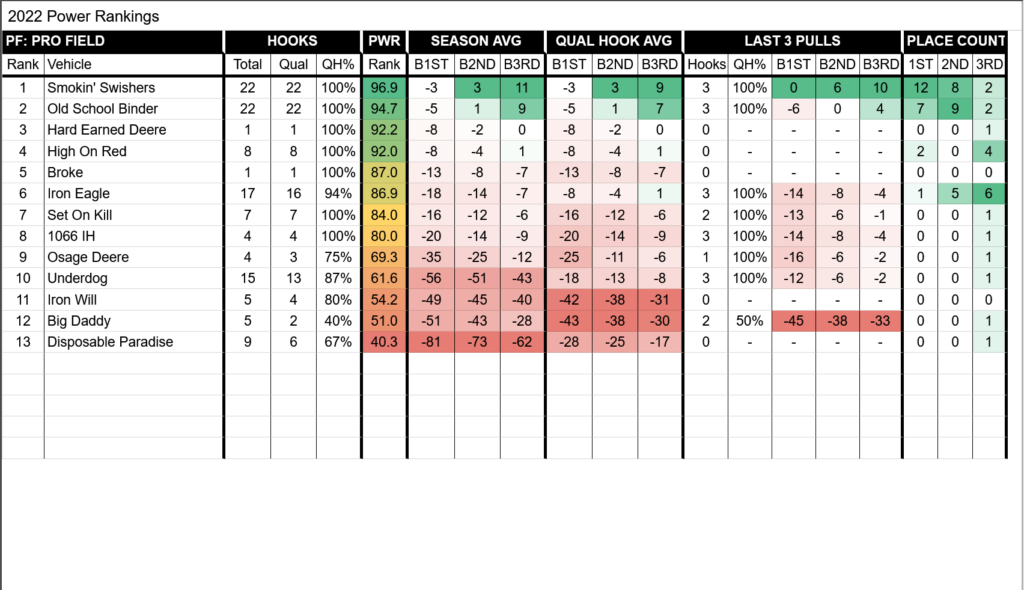
PF

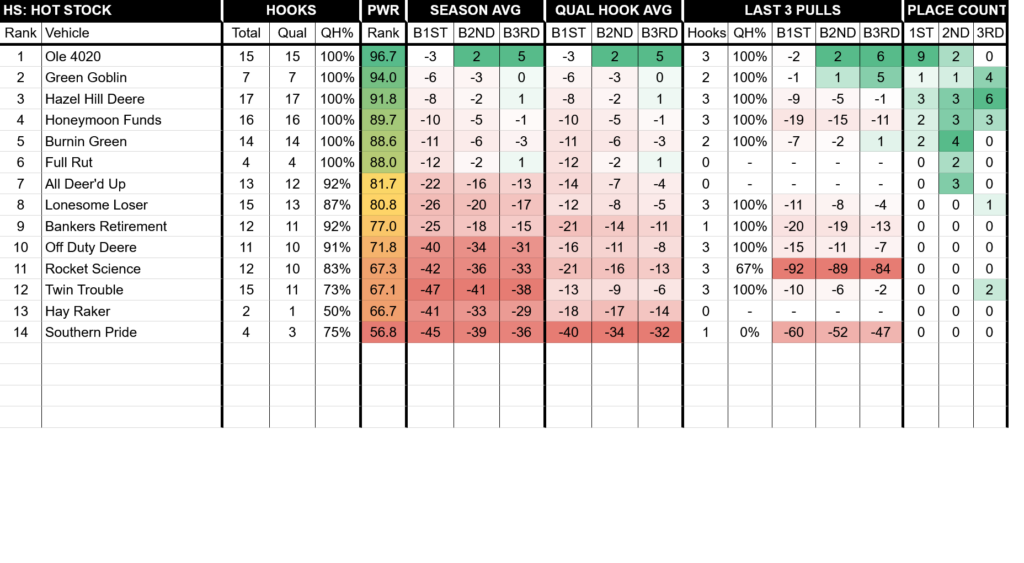
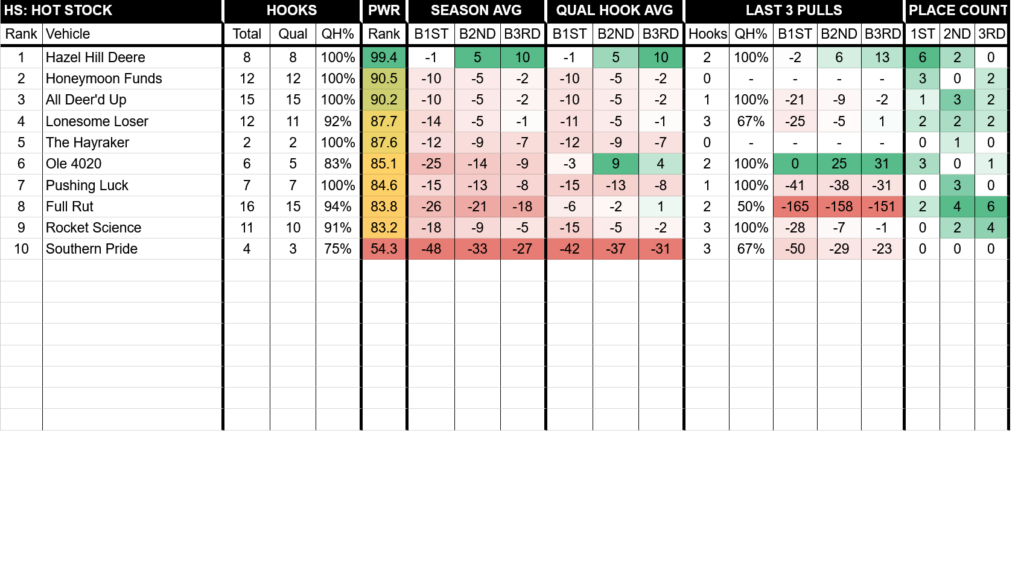
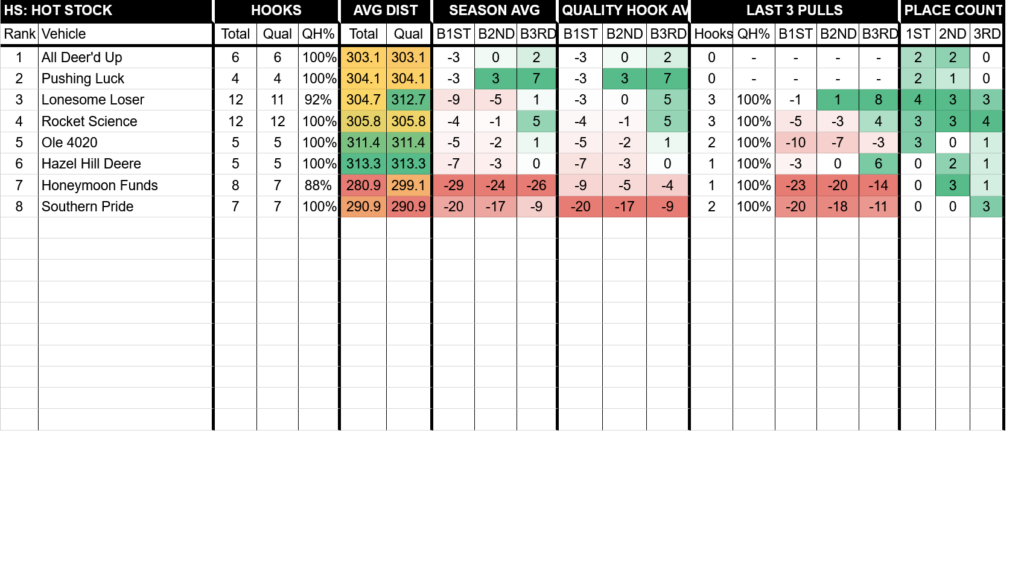
HS
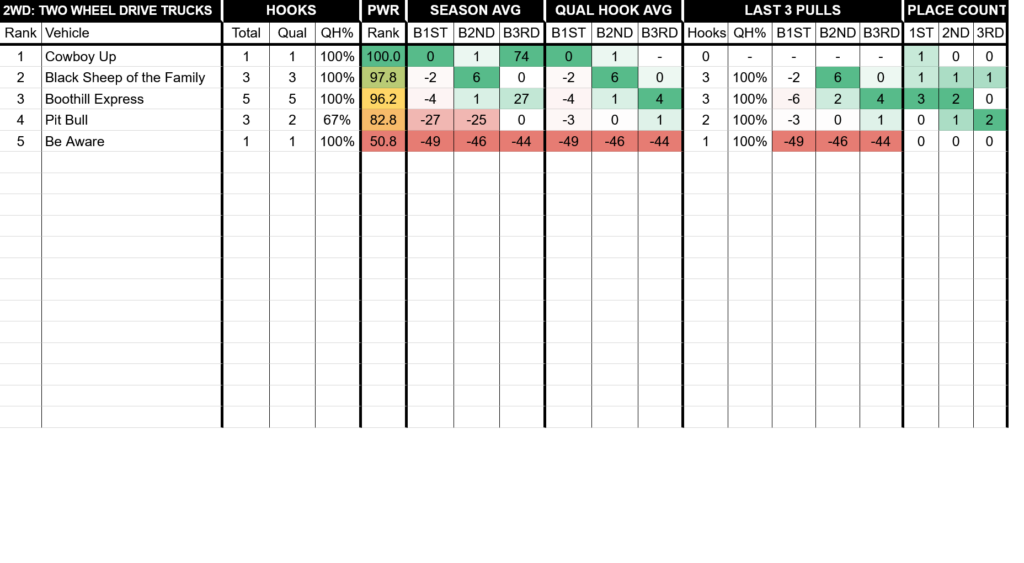
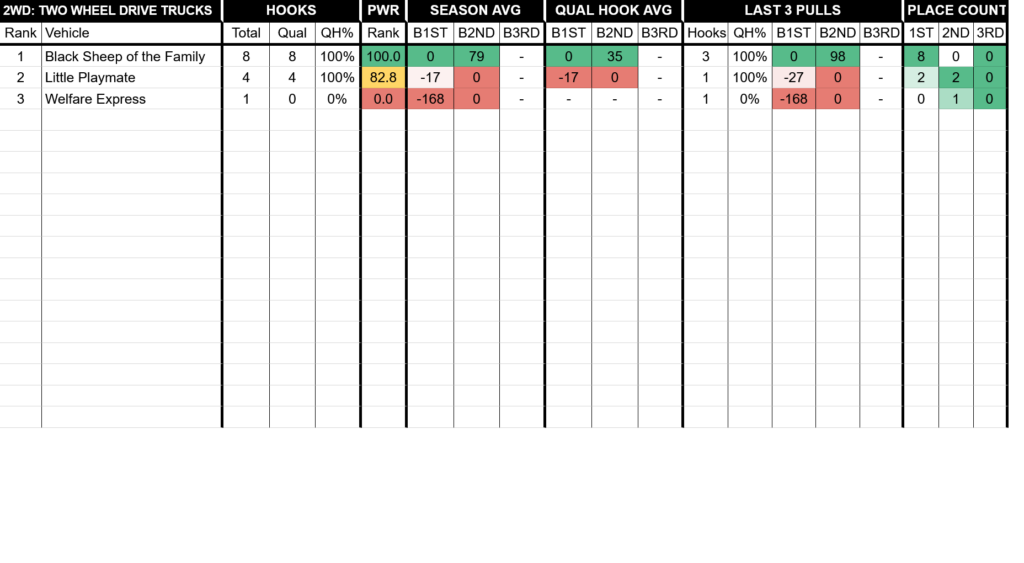
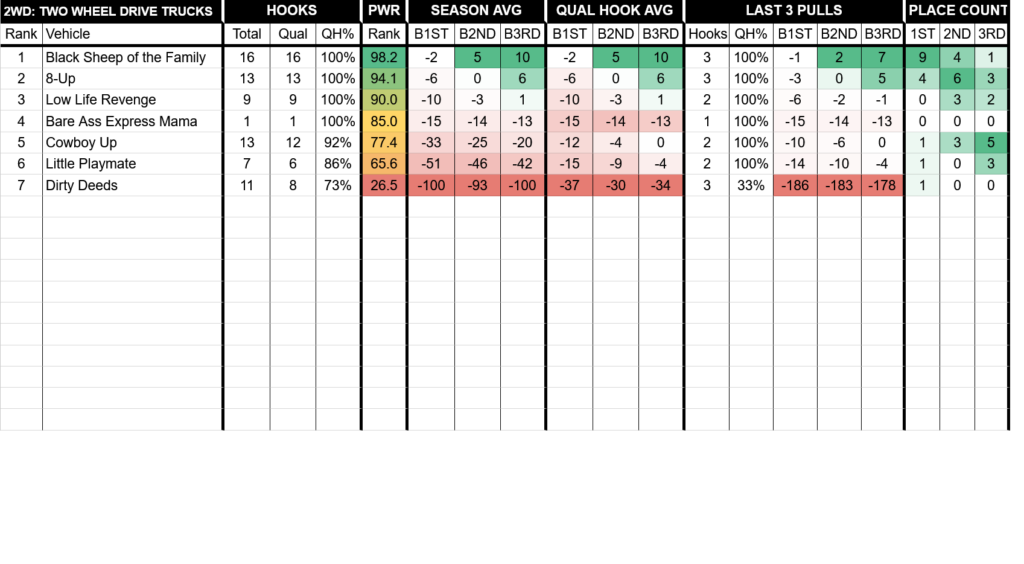
2WD
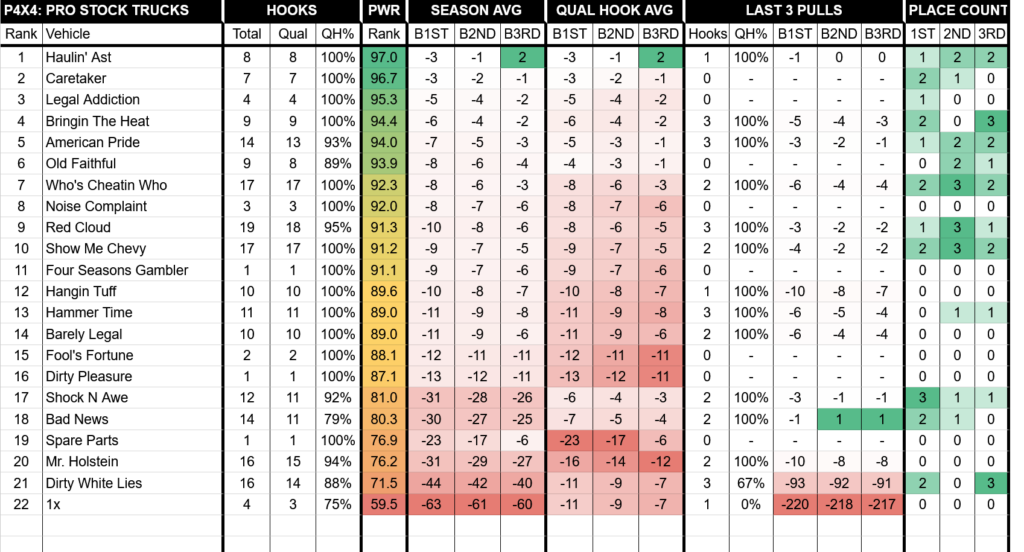
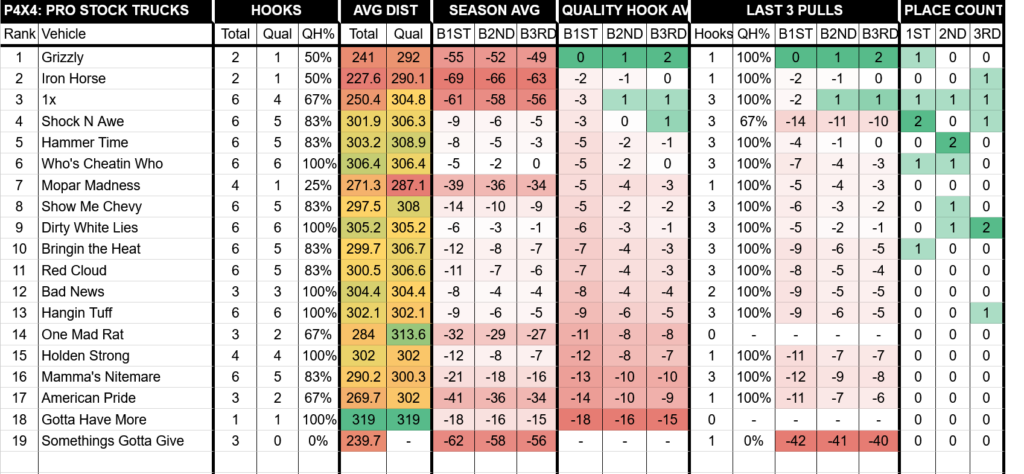
P4x4

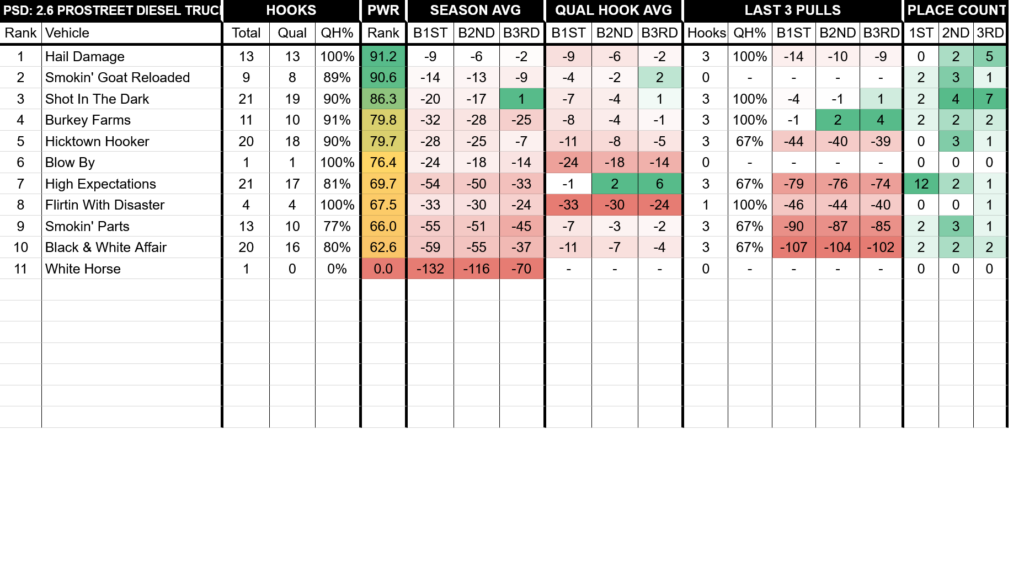
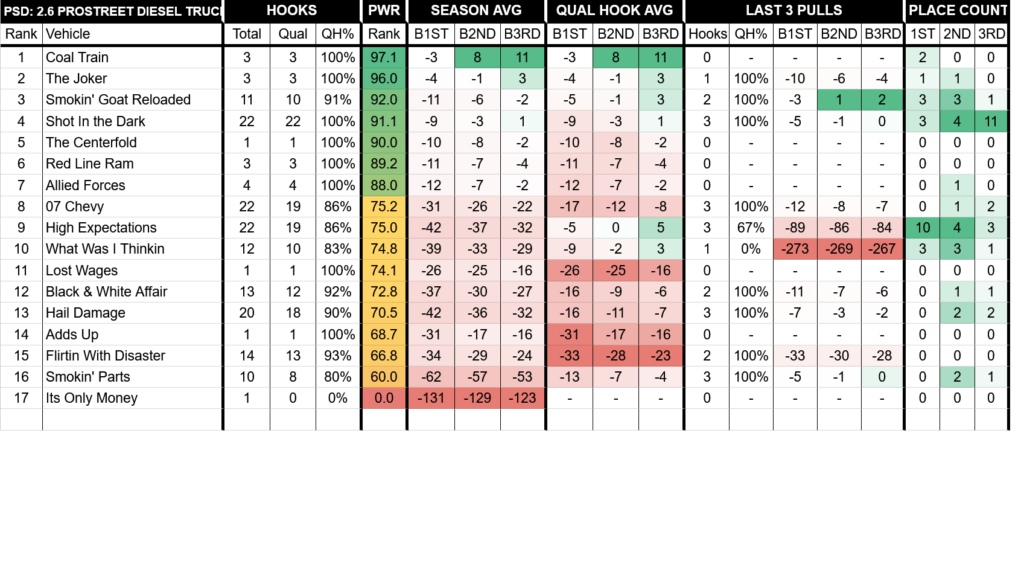
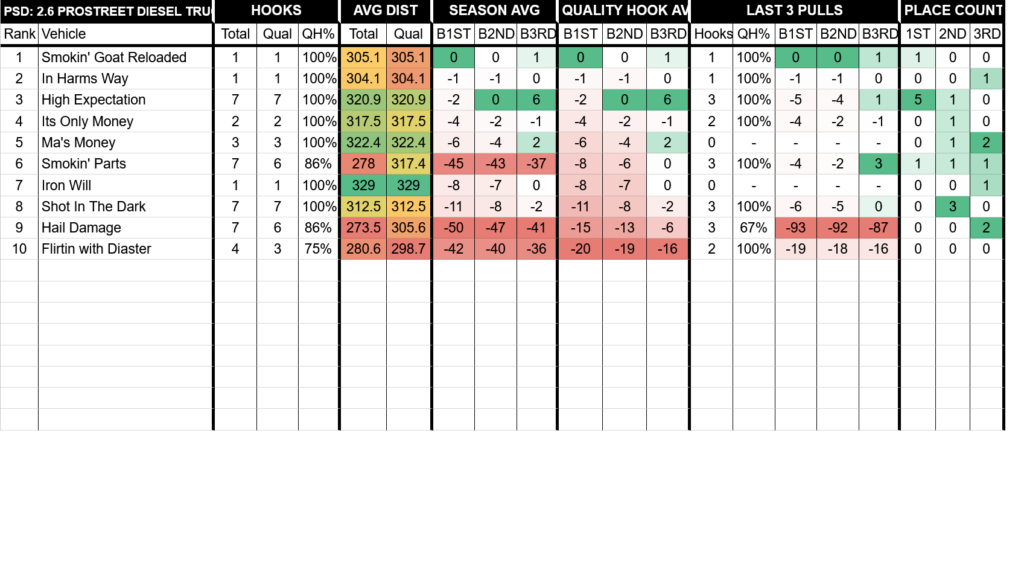
PSD
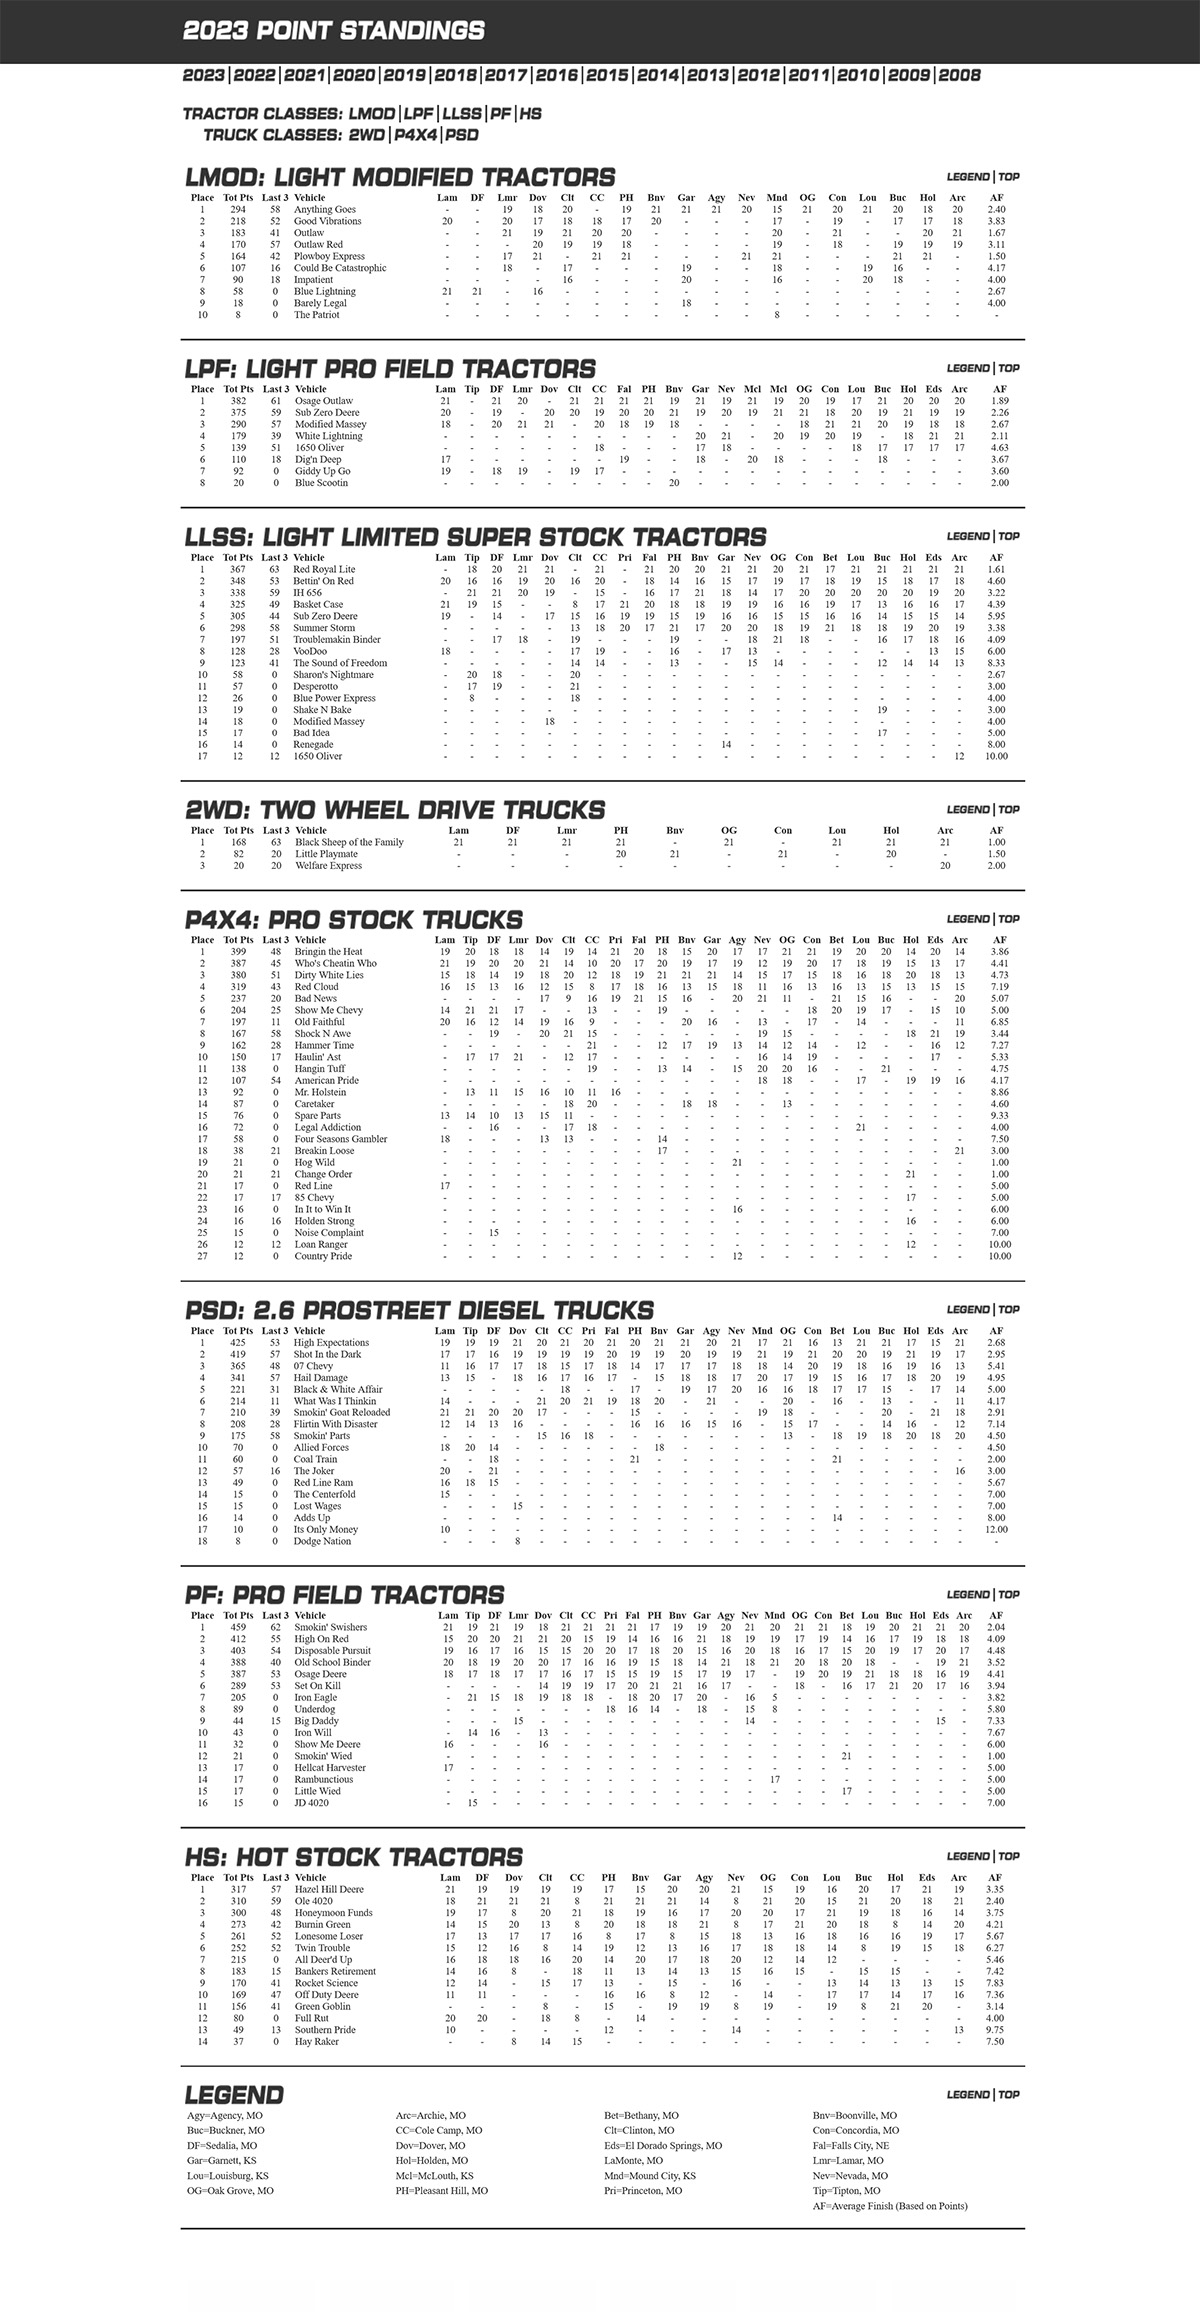
LMOD

LPF

LLSS

PF

HS
2WD
P4x4

PSD
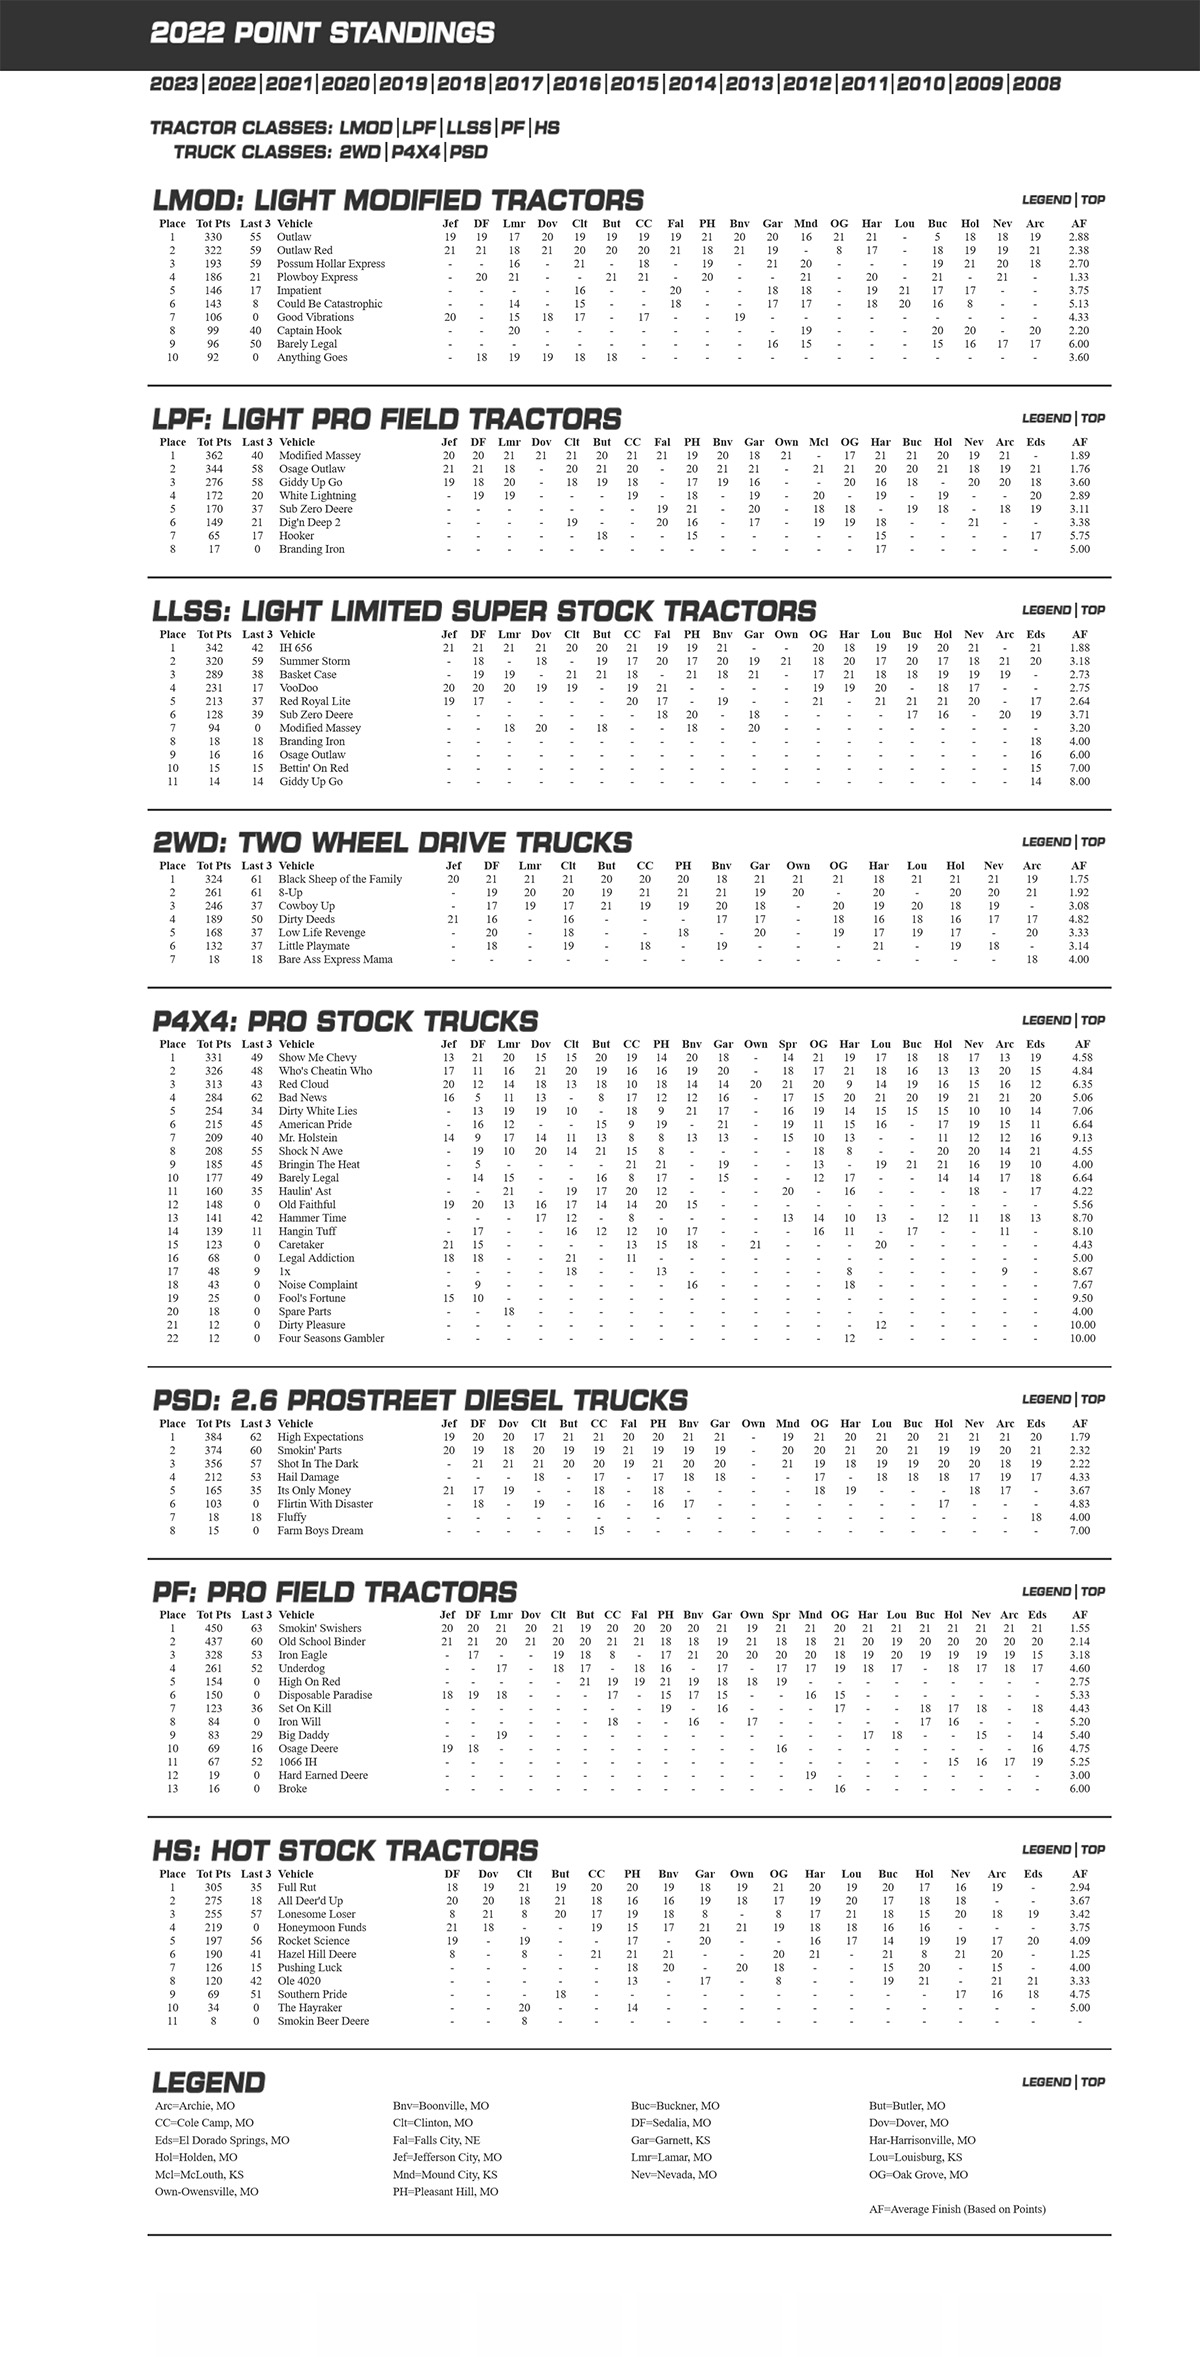
LMOD

LPF
LLSS

PF
HS
2WD
P4x4
PSD

LMOD
LPF

LLSS
PF

HS
2WD

P4x4

PSD

LMOD

LPF

LLSS

PF

HS

2WD

P4x4
PSD
LMOD
LPF

LLSS

MOD
85LPS

PF

LPS

HS
2WD

P4x4
WSD

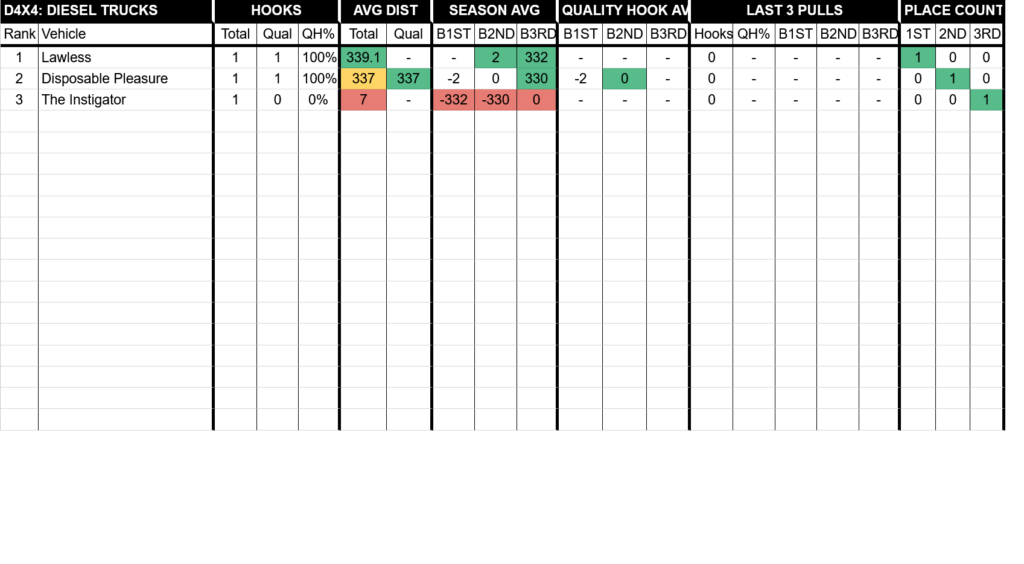
D4x4